
Management
Sales, returns and the day so far
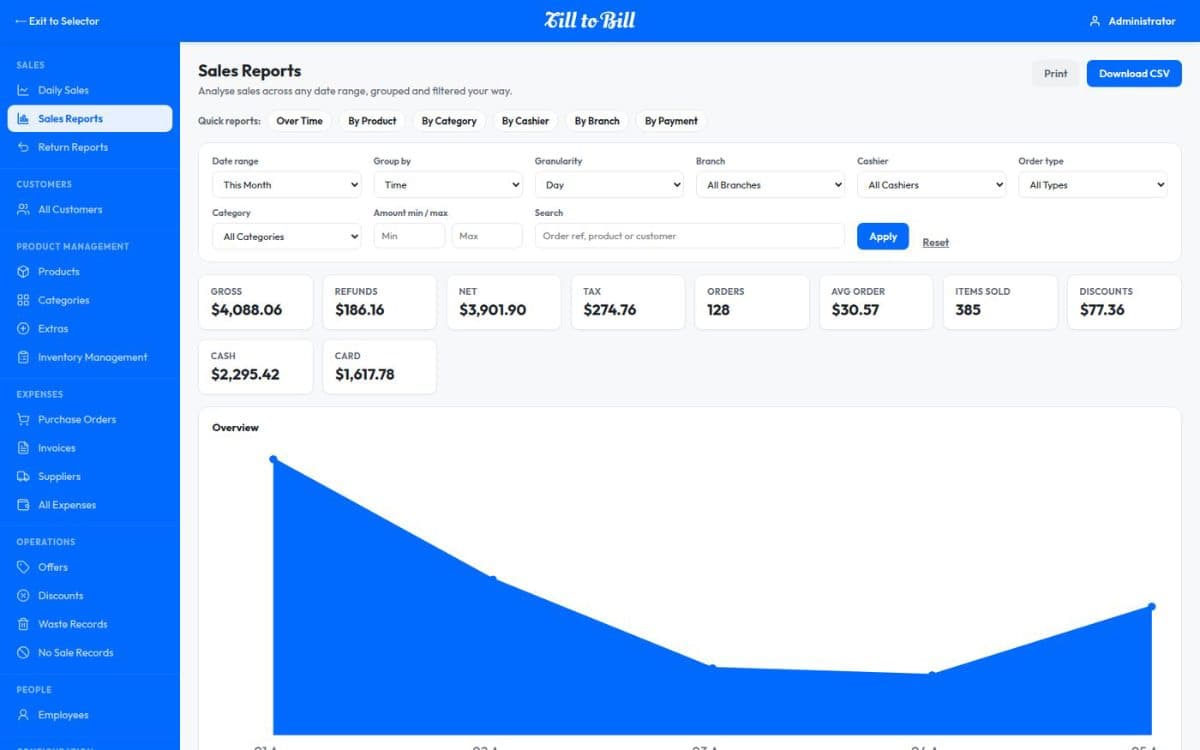
Three reports that get used: a sales report with the trend, a return report that shows what is coming back, and daily sales for the shift you are standing in.
How it works
Pick the window
Date range, branch and category filters at the top of every report.
Read the shape
Headline figures with a chart underneath, not a wall of rows.
Take it away
Download the report when the accountant asks.
What is included
Sales reports
Totals, order counts and average order value across a date range, with the trend charted.
Return reports
What is being returned and why, ranked by item, so the pattern shows up early.
Daily sales
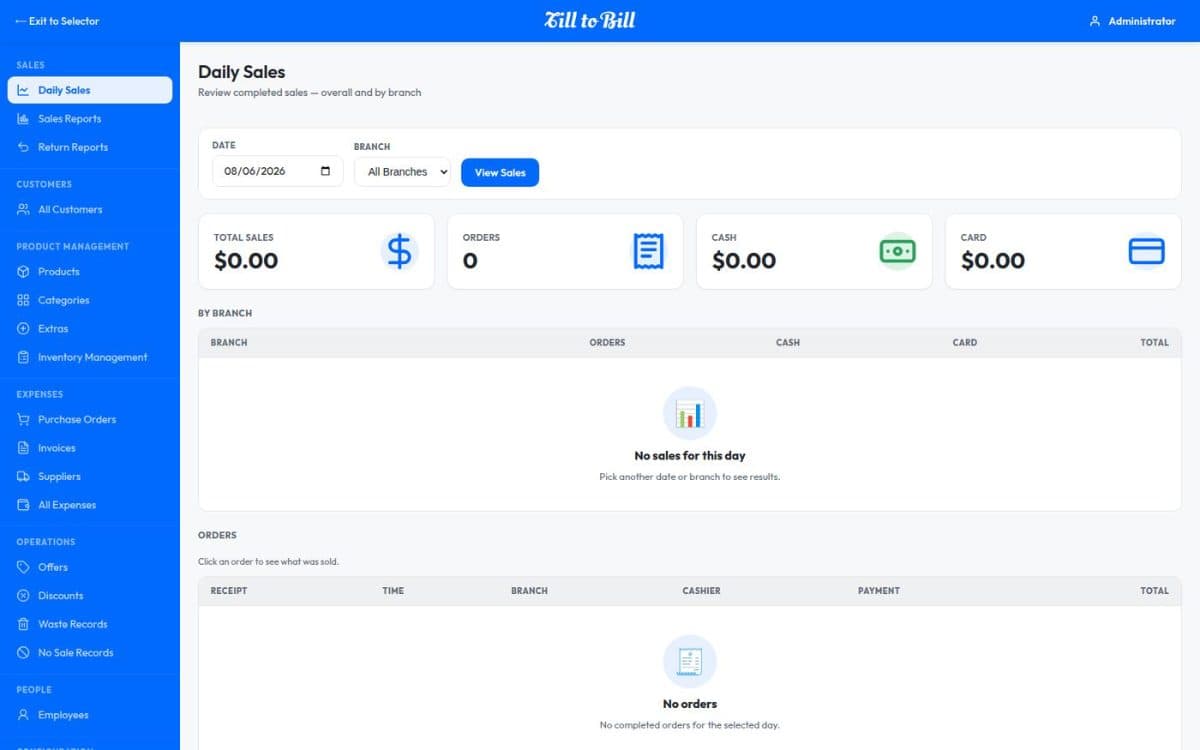
Today by payment method and order type, for the manager on shift rather than the owner at month end.
Branch filters
Every report filters by branch, so a group can compare sites on the same basis.
Four audited loss paths, all reported
Refunds, line returns, waste and no-sale are separate records with separate reports. That separation is what turns a vague shrinkage worry into a specific conversation.
- Refunds and returns reported apart
- Waste written off with a reason
- No-sale drawer openings logged
Questions we get asked
See it on your own menu
Send your menu across and we will build it into a live demo till before the call.